Analysing Entra ID Sign-in Logs with Grafana
Grafana is a powerhouse for observability, but it is only as useful as the data it has access to. Breaking down data silos to build an overall picture is the best thing administrators can do to provide a clear picture into their security posture, and Grafana is the closest thing I have to the fabled ‘single pane of glass’ vendors keep trying to sell me.
Attackers are targetting identity as the biggest entry point into networks, and the data stored in Azure Sign-in logs is crucial in providing insights into user behaviour and potential attacks.
In this post we will walk through how to get the logs from Entra ID into Grafana, and then how to build a dashboard using KQL queries that show exactly what your users are up to and help you spot an anomalies.
Table of Contents
Integration
Set up Log Analytics
The first thing we need to do is tell Entra ID to send all the sign-in logs to Log Analytics. This is where we are going to tell Grafana to pull log data from.
In Microsoft Entra ID, go to Diagnostic Settings under monitoring. At a minimum, we want to select AuditLogs and SignInLogs, then select your Log Analytics workspace. Save that, and Entra will now make all the logs available for querying.
Create App Registration
We now need to give Grafana a method to pull the data from Log Analytics, and we’re going to use an app registration for that.
- Open the Entra Admin Centre (entra.microsoft.com)
- Go to Entra ID, App Registrations (on the left)
- Register the new app
- Give the app a name
- Leave ‘Accounts in the organizational directory only’
- Leave the redirect URL blank
- Click Register
- Add a client secret
- Go to Certificates & Secrets
- Click ‘New client secret’
- Enter a description and select an expiry period
- Copy the Value; you won’t see this again
We now need to grant the app access to the Log Analytics workspace.
- Go to the Log Analytics workspace that has the sign-in data
- Go to Access Control (IAM)
- Click Add > Add Role Assignment
- Give the app you created the Log Analytics Reader role.
- Review and Assign.
Azure Monitor Data Source
The final step is to configure Grafana. We need the Azure Monitor data source which is included in Grafana. Go to Data Sources, Add a New Data Source, and select Azure Monitor.
Enter your Directory ID, App ID, and Client Secret. Select the Subscription and click Save & test.
Now we’re ready to start building our dashboard.
Grafana Visualisations
Success/Failure Over Time
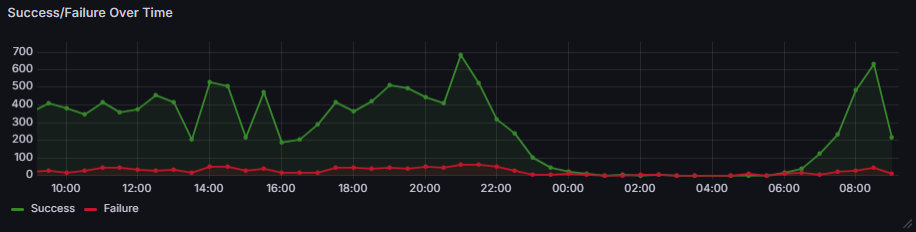
First up, we’re going to create a time series graph showing login trends over the time period of the dashboard. We simply want to see how many successful logins there are and how many failed logins. As always with this sort of data, we want to look for anomalies; if you see a huge spike of failed logs in the middle of the night, that can indicate an attack.
Here’s the KQL:
SigninLogs
| summarize
  Success = countif(ResultType == "0"),
  Failure = countif(ResultType != "0")
  by bin(TimeGenerated, 30m)
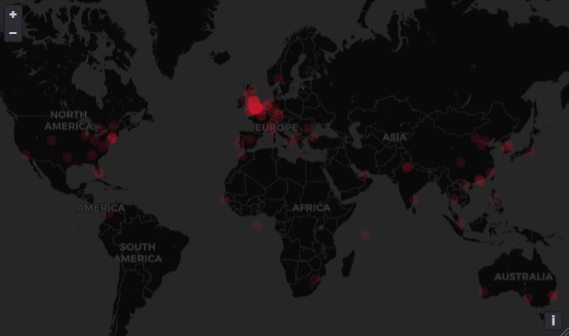
Login Locations

It’s also useful to know where your users are logging in from, and there are two ways of doing this. If you want a high-level overview by country, you can use the Location field:
SigninLogs
| summarize Successful=countif(ResultType==0) by Location
| project lookup = Location, Successful
Or, you can use the LocationDetails field which includes City. Obviously, this is the city of the ISP, so may not be completely accurate, but it makes a pretty visual.
SigninLogs
| extend LocationData = todynamic(LocationDetails)
| extend
    City = tostring(LocationData.city),
    Lat = todouble(LocationData.geoCoordinates.latitude),
    Lon = todouble(LocationData.geoCoordinates.longitude)
| summarize
    Successful = countif(ResultType == "0"),
    Failures = countif(ResultType != "0")
    by City, Lat, Lon
| project lookup = City, Lat, Lon, Successful, Failures
Legacy Authentication
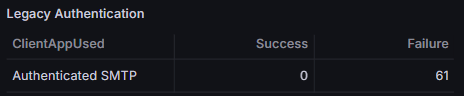
Microsoft is phasing out legacy authentication methods, such as SMTP, and they should be blocked using conditional access policies. However, it is worth monitoring them to know if users are trying to sign in using them, or being attacked.
If you see a large number of failures, that indicates a user is being attacked. If you see successes and you think you’ve disabled legacy authentication then that indicates an issue.
SigninLogs
| where ClientAppUsed in ("Authenticated SMTP", "AutoDiscover", "Exchange ActiveSync", "Exchange Online PowerShell", "Exchange Web Services", "IMAP4", "MAPI Over HTTP", "Outlook Anywhere (RPC/HTTP)", "POP3", "Reporting Web Services")
| summarize
    Success = countif(ResultType == "0"),
    Failure = countif(ResultType != "0")
    by ClientAppUsed
| order by Success desc
Account Lockouts

A nice easy one - we simply want to know what users have had account lockouts.
SigninLogs
| where ResultType == "50053"
| summarize LockoutCount = count() by UserPrincipalName
| sort by LockoutCount desc
MFA Methods
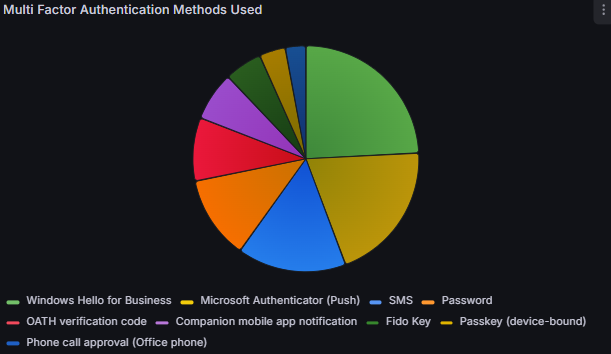
Once we’ve configured secure MFA settings, we’ll want to keep an eye on it. This visual will tell us what factors users are actually using to sign in.
SigninLogs
| where ResultType == 0
| where AuthenticationRequirement == "multiFactorAuthentication"
| mv-expand AuthDetails = parse_json(AuthenticationDetails)
| extend MethodUsed = tostring(AuthDetails.authenticationMethod)
| extend MethodUsed = case(
    MethodUsed == "Mobile app notification", "Microsoft Authenticator (Push)",
    MethodUsed == "Text message", "SMS",
    MethodUsed == "Voice call", "Phone Call",
    MethodUsed == "FIDO2 security key", "Passkey/FIDO2",
    MethodUsed
)
| summarize SignCount = count() by MethodUsed
New Authentication Method Registrations
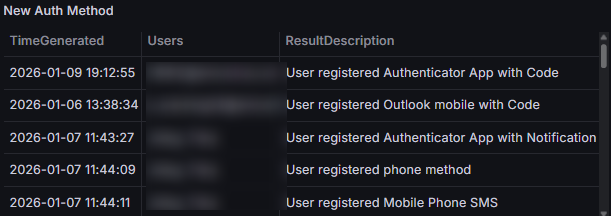
If an attacker gets into an account, they will look to ensure they can keep accessing it across multiple sessions. To do this, they will need to register another MFA method, so it’s worth keeping an eye on what is being registered, and when.
AuditLogs
| where OperationName == 'User registered security info'
| summarize by TimeGenerated, Identity, ResultDescription
| sort by TimeGenerated desc
Device Session Binding
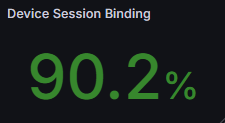
In this post we looked at DBSC and session binding as a method for mitigating session hijacking. Microsoft reports whether a session is bound when it authenticates, so we can analyse how many sessions are actually vulnerable to hijacking.
SigninLogs
| where TimeGenerated > ago(30d) and ResultType == 0
| extend TokenDetails = parse_json(TokenProtectionStatusDetails)
| extend isBound = iff(tostring(TokenDetails.signInSessionStatus) =~ "bound", 1, 0)
| summarize
    BoundCount = sum(isBound),
    TotalCount = count()
| project Percentage = (BoundCount * 100.0) / TotalCount
Applications
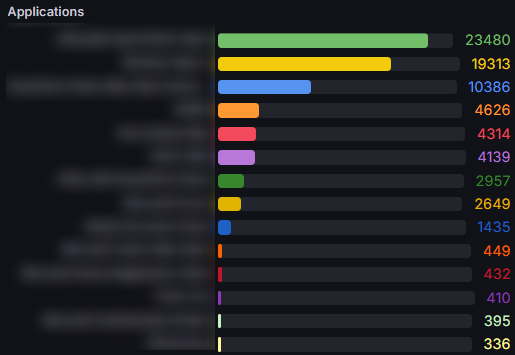
Let’s also look at applications in use, creating a profile of the top 20. Should any unfamiliar apps appear in that list then that warrants investigation.
SigninLogs
| summarize signInCount = count() by AppDisplayName
| limit 20
| sort by signInCount desc
We should also monitor for new apps, particularly given the new Clickfix and Consentfix attack vectors.
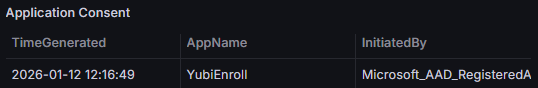
AuditLogs
| where OperationName == "Consent to application"
| extend AppName = tostring(TargetResources[0].displayName)
| extend Permissions = tostring(TargetResources[0].modifiedProperties[0].newValue)
| project TimeGenerated, AppName, InitiatedBy = Identity
Conclusion
Integrating Azure Sign-in logs into Grafana achieves visibility into your identity perimeter that just isn’t possible in Azure itself. By collating the data with other logs you have available, you can easily build a complete picture of your estate.
Whether it's spotting a surge in legacy authentication attempts, tracking a sudden shift in MFA methods, or monitoring for unauthorized application consents, this data tells a story. It turns out that "single pane of glass" we’re all constantly promised isn't a product you can buy off a shelf; it’s something you build by making your data available in a tool that has the ability to process it. It helps that it makes it look good in the process!
This is just a sample of the data you now have access to, and KQL is powerful enough to isolate anything you want to see. I am currently looking at building an ‘individual’ dashboard, with variables so I can drill into a particular user’s sign-in logs and establish their exact activities. Stay tuned!